

Diving Into Major League Equivalencies
Diving Into Major League Equivalencies
What are they and how can they be used to understand performance in the minor leagues?

Good morning! It’s free Thursday here at Down on the Farm. Our work is 100% supported by our readers, so if you’re enjoying the newsletter please consider subscribing. If you have feedback or suggestions, please let us know in the comments section below. Thanks for reading everyone!
What are MLEs?
Major league equivalencies, or MLEs for short, were one of the first areas of focus for early sabermetricians. Bill James is credited with developing the first set of MLEs, but people like Dan Szymborski and Clay Davenport have written about using them and have helped develop the methodologies as well. The goal of major league equivalencies is to take a player’s performance in the minor leagues and be able to say how that performance would have “translated” statistically in the major leagues. For example, if a batter hit .280 in the NPB, a major league equivalency system would be able to say that the batter would have hit .265 in MLB or .300 in Double-A. Of course, it’s impossible to perfectly say how a player would have performed in a different league based on what happened in the league they actually played in, but MLEs help provide a good baseline when discussing the present abilities of a player. Today, I’m going to walk you through my process for deriving major league equivalencies and explain why these are interesting to look at, even if they are not predictive in nature themselves.
Before jumping right into the methodology, I wanted to give some context as to why MLEs are useful. As I mentioned earlier, they provide a good baseline, especially at levels closer to the major leagues, and so for people in charge of making in season promotions, it’s helpful to have stats translated to one league for ease of comparison. A team may have a first baseman hitting .320 in Double-A, and if the first baseman on the major league team is struggling, it could be tempting to just call up the Double-A first baseman because on the surface his performance has looked better, but without proper context to how easier Double-A is than the majors, they may be performing exactly the same after adjusting for those factors. The other reason for developing MLEs is to use them in a prospect projection model. After converting minor league stats to all have one common baseline, they can be used to project future performance at the major league level, which is something most are interested in understanding. The translations themselves aren’t predictive, but they can be used in a predictive model more easily than raw minor league stats, and help us evaluate which players will make it to The Show.
Another thing to point out is that on the public side, we generally just have access to surface level stats like singles, homers, and strikeouts. We just now have access to Statcast data in the minor leagues for Triple-A and the Florida State League, but there isn’t a large enough data to use to develop MLEs for the entire minor leagues yet. That being said, there have been many people who build a Stuff+ model using MLB data, and then apply it to the minor league data, which allow people to say what a given minor league pitcher’s Stuff+ is relative to major league competition, and work like this is certainly being done by analytics departments for most major league teams. As (hopefully) more minor league Statcast data is released, public analysts will be able to develop MLEs around more granular data.
Creating the MLEs
Now let’s look into my methodology. In order to create MLEs, I looked at minor league data from 2018-2023 and then, for each statistic by year, I converted each player’s performance into a z score (a z score is the number of standard deviations above or below the average) based on league (i.e. Midwest League, Texas League, so on) to account for league specific factors. For hitters, I looked at strikeout rate, walk rate, singles rate, home run rate, and “extra base hit” rate, which is just the sum of doubles and triples. Given the relative rarity of triples, looking at triples rate by itself was noisy and so I decided to lump them in with doubles. All of the rate stats are at a plate appearance level.
On the pitching side, I looked just at strikeout and walk rate, which are the primary statistics I look at for a pitcher. After computing these z scores, I looked at players for a given season, played in both levels for a given promotion. The four promotions are “Single-A to High-A,” “High-A to Double-A,” “Double-A to Triple-A,” and “Triple-A to MLB.” For hitters, I looked at those who had 50 plate appearances in both levels, and on the pitching side, it was 50 batters faced. Then, for each player, I compared the z score at the higher level to the lower level, and then at a promotion level, looked at the average difference in z scores. This can then be translated to a percentage by multiplying the z score by the standard deviation of the higher level for a given year, though standard deviations are pretty standard across levels.
To then compute what a Double-A walk rate would translate to at the Major League Level, you just take the player’s walk rate at Double-A, and add the “Double-A to Triple-A” translation percentage, and then the “Triple-A to MLB” translation percentage to get an estimated MLB percentage. There are many different ways to do this, and obviously it’s not a perfectly correlated measurement, but as you will see below, this procedure leads to intuitively correct measurements on the direction of how these statistics interact with each other after a promotion.
A Look at Pitching MLEs
Let’s first take a look at the pitching equivalencies. I looked just at strikeout and walk rate, which are the two most important surface level pitching statistics in my opinion. In both cases, we see that the transition from Triple-A to MLB is the steepest, with a 0.73 difference in z scores for the strikeout side, and 0.49 difference for walk rate. What’s interesting is that the transition from Single-A to High-A is the second highest difference for strikeout rate, but the lowest for walk rate. We also see higher z score differences in strikeout rate than we do with walk rate, which is interesting. Without the requisite stuff, it’s easy to fall behind in strikeout rate as a pitcher works his way through the minor leagues.
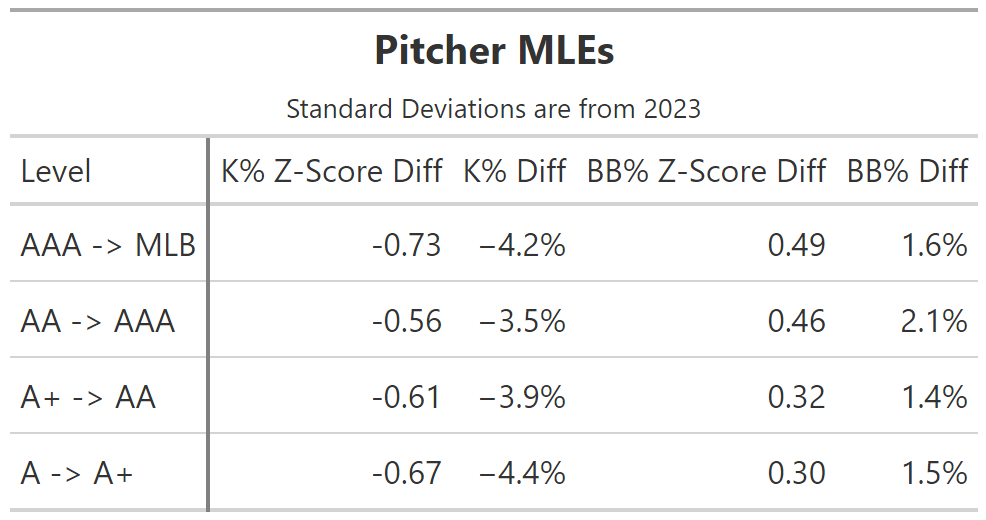
Currently, Santiago Suarez of the Charleston RiverDogs (TBR-A) is leading Single-A in K-BB% percentage at 25.4%. He has an outstanding 27.4% strikeout rate, with just a 2.5% walk rate, showing both plus stuff and command. These are impressive numbers, especially for a 19 year old, but even the best pitcher in Single-A would not come close to being a major league pitcher. After factoring in the MLEs, his strikeout rate in the majors would be roughly 11.4%, with a walk rate at around 9.1%, which comes out to a 2.3% K-BB%. For reference, Patrick Corbin is the lowest amongst qualified pitchers in the majors in K-BB% at 5.6%. This goes to show how difficult being a big league pitcher is, and even with the minor leagues being somewhat worse off now with minor league contraction, it is a long journey to pitching in the big leagues.
A Look at Hitting MLEs
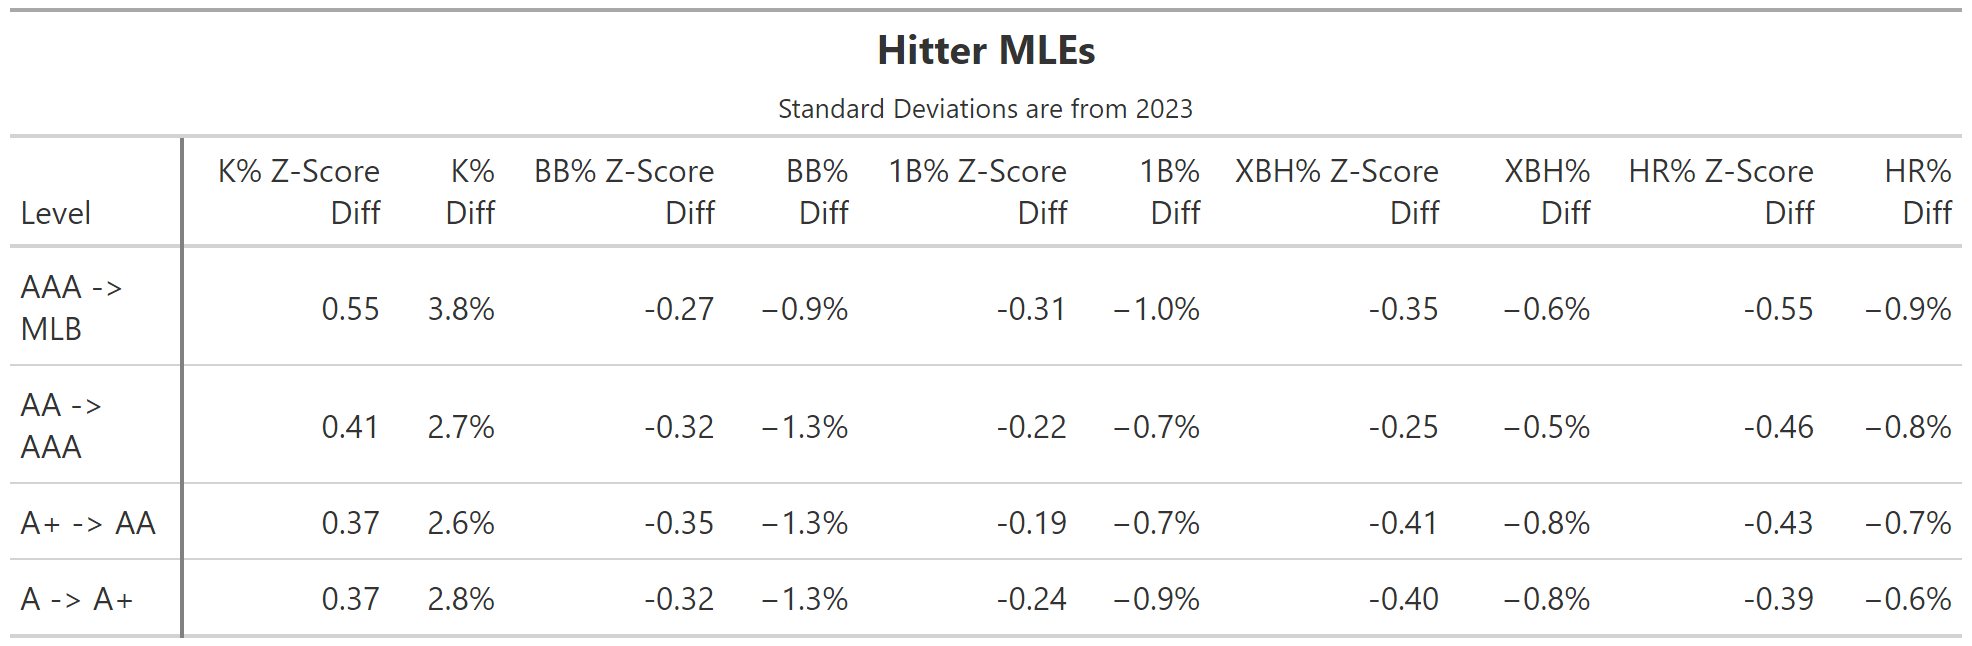
Let’s move onto the hitting side. Similar to what we saw on the pitching side, strikeouts are what see the biggest shift from a raw percentage viewpoint, though HR% has the highest average z-score difference. Like we saw with the pitching stats, the jump from Triple-A to the Majors is the hardest, with the exception of walks, but after that it is a bit of a mixed bag. Double-A to Triple-A has the second highest change in strikeout and home run rate, while having the lowest difference in extra base hit rate. The jump from Single-A to High-A and High-A to Double-A is very similar, with slight differences in strikeout rate and home run rate. In general, the most notable changes are from Triple-A to MLB, and then the decreases from lower levels are roughly constant. Most importantly, the direction of changes all looks correct. It would be nice to get promoted to the Majors and have it be easier to hit homers, but that’s not all that realistic.
A couple translations I found interesting came at Triple-A. Henry Davis had a rough time in the majors this year, hitting just .153/.267/.235, but his MLE Triple-A adjusted line is .273/.341/.553. He’s absolutely torn up Triple-A this year, and I’d expect him to be better once he is back in the major league lineup. The other was Ben Rice, who has been playing very well so far this year, and Yankees fans have been clamoring for him to get an opportunity, which he may get soon with Anthony Rizzo out for the next month or two. Rice started out the year in Double-A, slashing .261/.383/.511 in 49 games, before getting promoted to Triple-A, where he has been mashing, hitting .333/.440/.619 in 11 games. The minor league equivalencies of the slash lines are .205/.315/.342 and .329/.423/.577 respectively. I would bet he ends up closer to that Double-A line than the Triple-A line, but still this is someone who can hit .230 and 15 homers the rest of the year, which is more than what Rizzo was providing, and probably better than the other comparable options.
MLEs, What Now?
Lastly, I did want to address one obvious bias here, which is the selection bias. Not every player that makes it to Single-A goes to High-A, not every Triple-A player makes it to the Show. Since this study looks at players that did make that leap, these equivalencies are overestimating how well the average Single-A player would do in the Majors right now. Given this bias, you can think of these translations as the “best-case” scenario.
In conclusion, hopefully these MLEs are helpful for those interested in comparing prospects, and getting an idea how their current performance would translate to the big-league level. For me, the most eye-opening thing is just how good you have to be to become a major leaguer. It’s trite, but these players are really good, and for even the best A ball player would struggle against big league competition. You can find current MLE adjusted stats right here.