How To: Creating Cumulative Stat Plots Using Game Logs
Plus our usual daily minor league report
If coding and working with data is of no interest to you, skip down to the sections covering last night’s minor league games. If you know someone who might be interested, please share our post!
Important note: The tutorial posts assume that the reader has at least a basic understanding of R. If you've never written a line of code or worked with baseball data, there are many excellent introductory resources. R for Data Science by Hadley Wickham & Garrett Grolemund is a great place to start. It covers everything you'll need to know to begin working with data, performing analysis, and building visualizations.
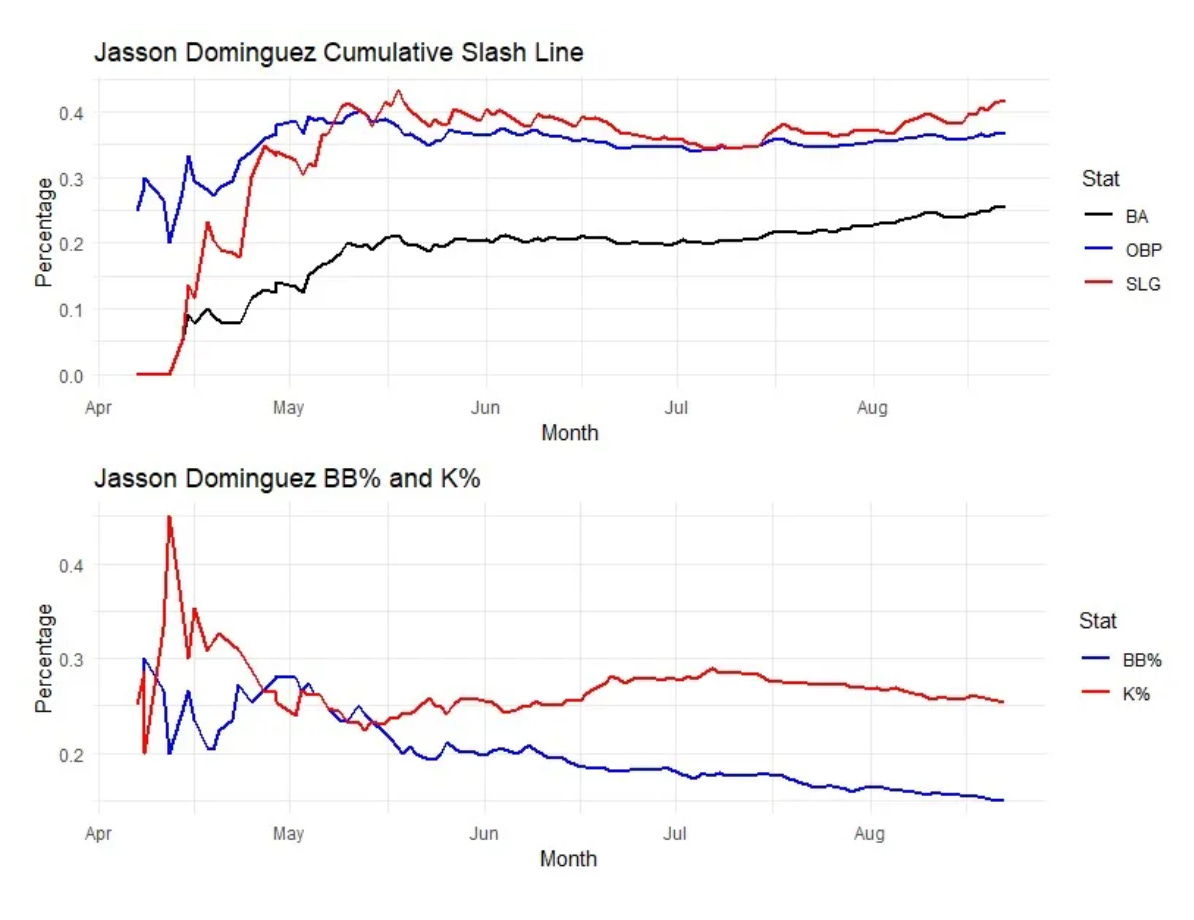
Last week on the site, I wrote a prospect spotlight piece about Jasson Domínguez. In case you missed it, give it a read. The purpose of today’s post is to demonstrate how to create the cumulative stat plots made for Domínguez seen here…
These charts require just two libraries to be loaded, and then a third if you want to stack the charts on top of each other in a similar way as shown in the previous post. This is a simple, self-contained example for how to create an informative plot. Pretty much anyone can do this with just a few lines of code!
library(baseballr)
library(tidyverse)
library(gridExtra) # optional
In order to get minor league game logs through the baseballr package, there’s a function to pull the data in through FanGraphs. This function requires a FanGraphs player id and a season. There are multiple ways to find a FanGraphs player id, but the easiest way is to go to a player’s specific page and look at the URL. For Jasson Domínguez, the URL is:
https://www.fangraphs.com/players/jasson-dominguez/sa3014696/stats?position=OF
The part that bolded is the player id. This is consistent across players, so you will always find the id in the same spot of the URL. Now let’s take that player id and pull in the data.
jasson <- fg_milb_batter_game_logs("sa3014696", 2023)The resulting data frame has 58 columns, and lists everything you would find on the FanGraphs game log. Unfortunately, FanGraphs doesn’t give us everything we need for our plot so we’ll have to do some manual calculations. Let’s start with the cumulative slash line plot. Here is the code:
Keep reading with a 7-day free trial
Subscribe to Down on the Farm to keep reading this post and get 7 days of free access to the full post archives.


