How To: Scraping MVP Results & WAR Data
Scraping historical MVP results data and plotting it by wins above replacement
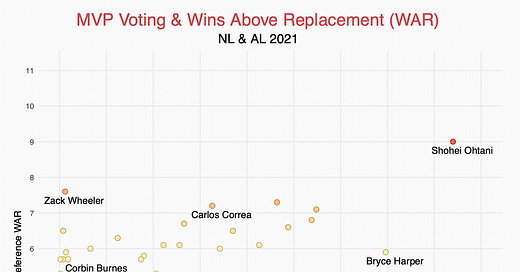
Good afternoon! Today’s tutorial will walk through how to make the plots from yesterday looking at historical MVP results and WAR from yesterday’s post. The tutorial posts will be for premium subscribers only, but we’ll occasionally post them for everyone like we did a few weeks ago. You can find that post here.
If you are a premium subscriber and don’t care about R or coding, you can skip past this section and go right to the updates from the Arizona Fall League last night by clicking HERE.
Important note: The tutorial posts are going to assume that the reader has at least a basic understanding of R. If you’ve never written a line of code or worked with baseball data, there are many great introductory resources out there. A great place to start is R for Data Science by Hadley Wickham & Garrett Grolemund. It covers everything you’ll need to know to begin working with data, performing analysis, and building visualizations. RStudio also puts out many great resources like this guide for getting started in R.
Scraping MVP Voting & WAR Data from Baseball Reference
We aren’t going to go through the entire post from yesterday line-by-line, but we’ll get you started with some of the code to scrape the data from Baseball-Reference and pop it in some tables and plots.
# load packages needed
library(tidyverse)
library(rvest)
library(janitor)
library(data.table)
library(stringr)
library(gt)
library(gtExtras)
library(ggrepel)
library(prismatic)

# set theme for plot
theme_scott <- function () {

 theme_minimal(base_size=9) %+replace%
 theme(
    panel.grid.minor = element_blank(),
    plot.background = element_rect(fill = "#F9F9F9", color = "#F9F9F9"),
    )
}
The first thing we need to do is get our data. We’re going to build a little web scraper using the rvest package that grabs some data from Baseball-Reference.com. We’ll show you how to write a function that will scrape the data, clean it, then combine it by year. But first we’ll break it down in small steps.
# set the year we want for the MVP voting
year = 2021

# create URL needed to grab the results, inserting in the year variable
url = paste0('https://www.baseball-reference.com/awards/awards_', year, '.shtml#AL_MVP_voting_link')

# get the results for MVP voting from the AL in 2021
al = url %>%
   read_html() %>%
   html_nodes("#AL_MVP_voting") %>%
   html_table()
Keep reading with a 7-day free trial
Subscribe to Down on the Farm to keep reading this post and get 7 days of free access to the full post archives.


